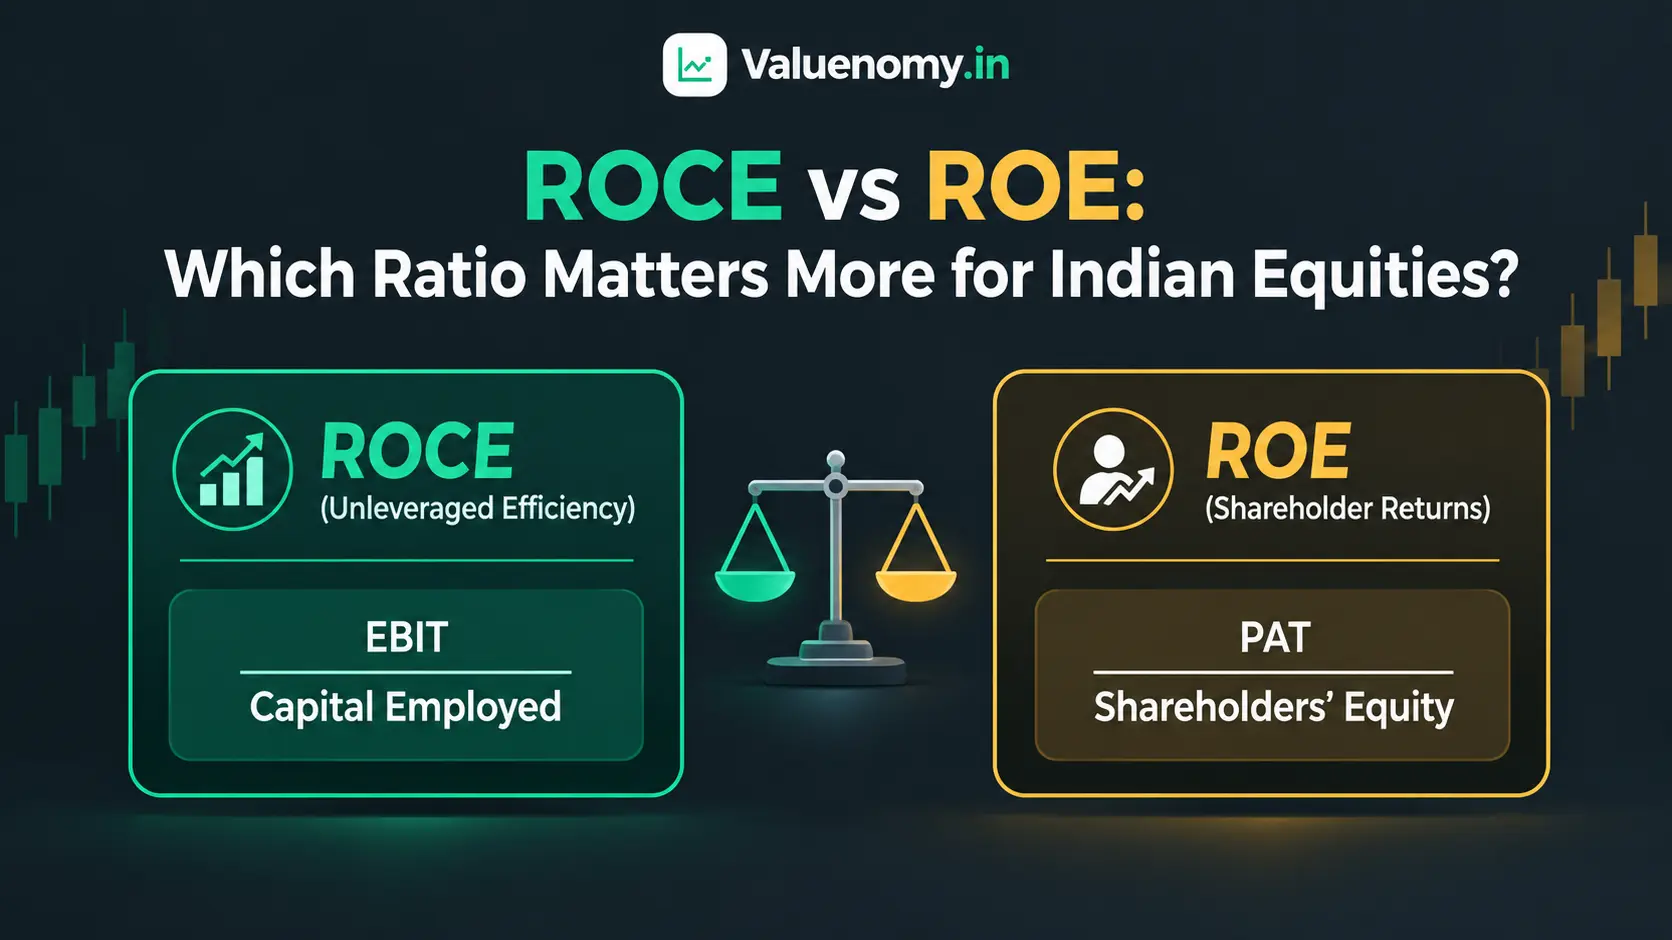
Return on capital employed (ROCE) vs Return on equity (ROE): which is more important for Indian equities?
- Valuenomy Research
- Valuation Guides
- 09 Sep, 2026
Assessing the profitability of a business is the first step in fundamental equity research. While screening equities on the National Stock Exchange (NSE) or Bombay Stock Exchange (BSE), two important fundamental ratios emerge as critical success factors for any investment decision: Return on Capital Employed (ROCE) and Return on Equity (ROE).
While both ROCE and ROE seek to measure the earning capacity of a firm for every Rupee of capital, the two ratios view the balance sheet from different perspectives. A firm could have a roaring 35% ROE while masking its leverage-driven risks and an asset-intensive capital good firm could have a low ROE while simultaneously offering an attractive unlevered ROCE of 18%. Understanding the subtle differences between the two ratios helps separate value traps from quality compounders.
ROCE vs ROE: Know the fundamental difference
To understand the nuances between the two ratios, let’s first break down the basic definitions and computations in accordance with Indian accounting standards:
ROE: The Investors’ Perspective
ROE or Return on Equity is the ratio of net income/profit of a firm to its total shareholders’ equity (SE). In other words, it measures the profits that a firm can generate for every Rupee of shareholders’ capital.
ROE = (Net Profit after Tax / Total Shareholders' Equity) * 100
- PAT (Profit & Loss): It is the net profit of the firm as captured in the profit and loss statement, which factors in all expenses (wages, depreciation, interest, and exceptional losses) and taxes.
- Shareholders’ Equity (SE): It is the shareholders’ book value claim on the firm calculated as the sum of equity share capital, reserves and surplus, and adjustments for miscellaneous expenses and losses.
ROCE: The Enterprise’s Perspective
ROCE or Return on Capital Employed is the ratio of a firm’s earnings before interest and taxes (EBIT) to its capital employed or long-term capital. It captures the returns generated by a firm before financing decisions are factored in, thus shedding light on its core operational efficiency.
ROCE = (EBIT / Capital Employed) * 100
- EBIT (Operating Profit): It is the firm’s profit after adjusting for all operating costs or expenses (material, wages, depreciation, and other expenses) from gross revenue. It essentially strips away financial and tax costs, focusing on the revenues generated by core operations.
- Capital Employed: There are two ways to calculate capital employed:
- Liabilities-Based: Shareholders’ Equity + Total Non-Current Liabilities (Long-term Debt)
- Assets-Based: Total Assets – Current Liabilities
ROCE vs ROE: Know the key differences
ROCE (Return on Capital Employed) and ROE (Return on Equity) are fundamentally different measures. While the former analyzes operational efficiency, the latter assesses the ability of the firm to generate returns for shareholders. Here is a summary of the key differences:
| ROCE vs ROE: Key Metrics | ROCE Key Metrics | ROE Key Metrics |
|---|---|---|
| Scope of Capital | Total long-term capital: Equity + Long-term Debt | Net Worth: Shareholders’ equity capital |
| Measurement of Earnings | Pre-financing profits: EBIT | Bottom-line profits after all expenses: PAT |
| Leverage Adjustment | Neutral: Leverage doesn’t distort the ratio | High leverage can make ROE artificially high |
| Primary Beneficiaries | Whole enterprise: Debt + Equity shareholders | Only equity shareholders |
| Applicable for | Capital-intensive sectors such as Power, Infrastructure, Auto, and Heavy Industry | Capital-light sectors such as IT, Consumer Brands, and Platforms |
| Debt Distortion Risk | EBIT ignores debt payment costs, and interest payments on debt can drag down ROCE | ROE is highly susceptible to leverage |
ROCE vs ROE: How high debt can distort ROE
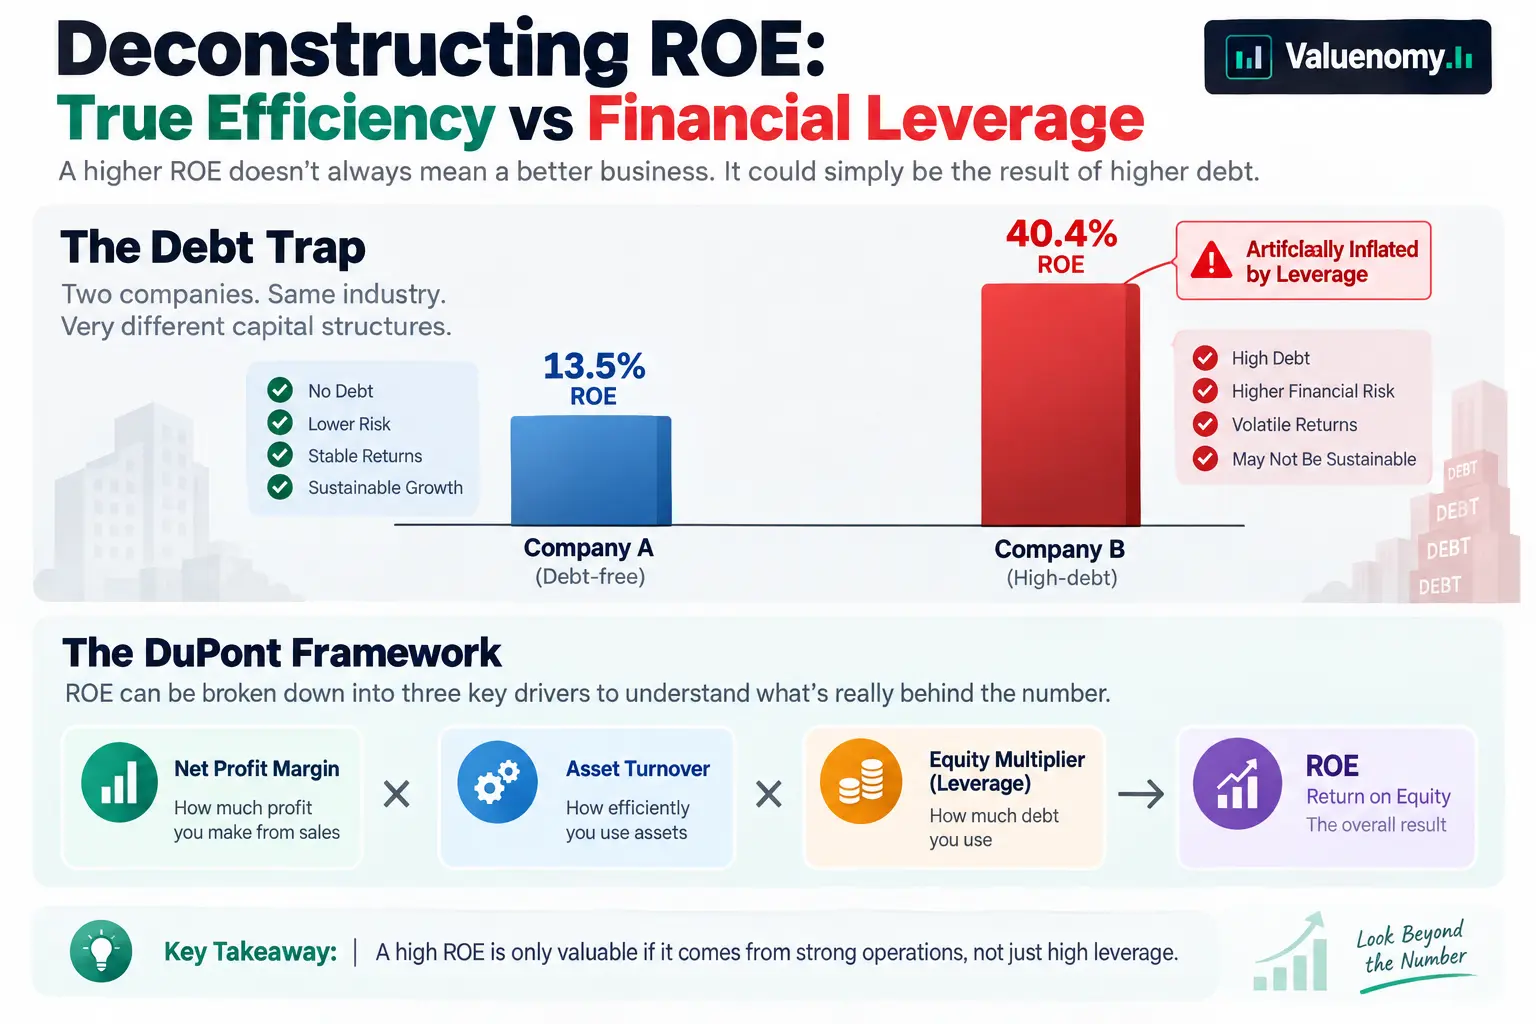
One of the most common value traps in fundamental stock research while screening equities by ROE is the debt-distorted ROE. In other words, if a company takes on large amounts of debt to finance its capital expenditures, the denominator in the ROE calculation (Shareholders’ Equity) becomes smaller, making ROE artificially larger.
Let’s understand the concept with the help of an example:
Comparative Balance Sheet Example
Suppose there are two similar firms, Company A and Company B, that want to raise ₹1,000 Crore of total capital to set up identical manufacturing facilities. Both companies have identical EBIT of ₹180 Crore.
| Particulars | Company A: Conservative/No Debt | Company B: Aggressive/High Debt |
|---|---|---|
| Equity Capital | ₹1,000 Crore | ₹200 Crore |
| Debt | ₹0 | ₹800 Crore |
| Interest on Debt (9%) | ₹0 | ₹72 Crore |
| Profit Before Tax (EBIT) | ₹180 Crore | ₹180 Crore |
| Tax @25.17% | ₹45.3 Crore | ₹27.18 Crore |
| Profit After Tax (PAT) | ₹134.7 Crore | ₹80.82 Crore |
| ROCE | 18% | 18% |
| Shareholders’ Equity | ₹1,000 Crore | ₹200 Crore |
| ROE | 13.47% | 40.41% |
From the example above, here are some insights:
Insights: ROCE vs ROE
- Capital Employed: ₹1,000 Crore for both firms.
- Operating Profits: Identical at ₹180 Crore.
- ROCE: 18% for both firms.
- Shareholders’ Equity: Company B’s SE is just 20% of Company A’s SE.
- PAT: Company A retains more profit after tax than Company B.
- ROE: Company B’s ROE is thrice that of Company A’s ROE. A naive fundamental analyst who only screens for ROE 30% would automatically select Company B, not realizing the extent of leverage in the capital structure.
In the event of an economic slowdown or a rising interest rate scenario, if the EBIT were to decrease by 50% to ₹90 Crore, the PBT for Company A would also be ₹90 Crore while that for Company B would only be ₹18 Crore (after adjusting interest on debt). In other words, Company B’s PBT would have fallen by 81%, threatening its debt servicing capabilities.
Golden Rule: If ROE is significantly greater than ROCE, the firm is dangerously leveraged.
ROCE vs ROE: How to deconstruct ROE
To decode the true power behind ROE, expert fundamental analysts use the 3-step DuPont analysis to deconstruct ROE into its component parts:
ROE = Net Profit Margin * Asset Turnover * Financial Leverage
ROE = (PAT / Sales) * (Sales / Assets) * (Assets / Equity)
- Net Profit Margin = PAT/Sales: Measures the extent of cost control and pricing power of the firm.
- Asset Turnover = Sales/Assets: Reflects the efficiency of capital employed to generate sales.
- Financial Leverage = Assets/Equity: Captures the degree of financial leverage used.
By using the DuPont analysis, you can assess whether a rising ROE is on account of better margins, efficient use of capital, or aggressive leveraging. If a firm’s ROE has risen from 15% to 28%, for instance, you could determine if the increase was on account of higher operating margins or asset turnover or simply because the firm’s equity had reduced (due to increased leverage).
ROCE vs ROE: Which one is important for different sectors?
The capital requirements vary significantly for different sectors depending on whether the sector is capital-intensive or not. Here is a snapshot of the various sectors in the Indian economy:
ROCE Focus: Capital-Intensive Sectors
- Sectors Examples: Steel, Commercial Real-estate, Power, Auto OEMs, Heavy Infrastructure, Capital Goods, Construction, etc.
ROCE is a more relevant metric than ROE for capital-intensive sectors as they require large-scale long-term borrowings to finance their capital expenditures. ROCE helps assess whether the operating profits are sufficient to cover coupon obligations on long-term debt. ROCE should be consistently higher than the weighted average cost of capital (WACC) or the opportunity cost of capital for firms in these sectors.
ROE Focus: Capital-Light Sectors
- Sectors Examples: IT Services, FMCG, Consumer Discretionary, Diagnostic Labs, SaaS, etc.
ROCE and ROE are relatively similar for capital-light sectors as the majority of such firms don’t leverage bank loans to finance their working capital needs. In other words, such firms have negligible interest costs, and hence, ROCE and ROE primarily reflect the power of their business model. ROE is a better proxy for assessing the extent of compounding potential for such firms.
ROE Metrics: Financial Sectors
- Sectors Examples: NBFCs, Banks, Housing Finance Companies, Microfinance, Asset Management Companies, etc.
ROCE is an irrelevant metric for financial sectors as financial institutions such as banks and NBFCs don’t operate with physical assets. Their revenues and profits are generated by the interest rates earned on the loan book. Similarly, EBIT or operating profits are also irrelevant for financial institutions as interest payments are treated as operating expenses, not financing costs.
ROCE vs ROE: Observations from the NSE
Let’s take a deeper look at the ROCE vs ROE for a better understanding of the dynamics between the two. Let’s take a look at three different types of firms:
Type 1: The moat company: High ROCE + High ROE
- Example: Leading Fast-Moving Consumer Goods (FMCG) Company or IT Export House.
- Balance Sheet Characteristics: Debt-to-Equity ratio is either zero or less than 0.10; strong cash flows.
- ROCE: 32%, ROE: 28%
- What does it mean? The company has a powerful business moat that allows it to generate high returns on its physical capital. The firm reinvests its profits and has excess cash to reward shareholders in the form of dividends and buybacks.
Type 2: The leveraged infrastructure mirage: Low ROCE + High ROE
- Example: Aggressive Road BOT or Power developer.
- Balance Sheet Characteristics: Debt-to-Equity is more than 2.5x.
- ROCE: 10.5%, ROE: 24%.
- What does it mean? The developer earns low returns (10.5%) on the capital employed in the projects under development. Assuming that the developer has raised ₹500 Crore of long-term debt at 9.5%, the interest burden would be ₹47.5 Crore. If the project’s revenue stream is interrupted due to any reason, the developer’s ROE will fall sharply. For such firms, an ROE of 24% is a mirage as the interest payments and project completion risk can derail the business.
Type 3: The reinvestment dynamo: High ROCE + Moderate ROE
- Example: A speciality chemicals manufacturer or precision engineering firm.
- Balance Sheet Characteristics: Cash balance on the books to fund brownfield capex; minimal debt.
- ROCE: 26%, ROE: 16%.
- What does it mean? The firm’s cash balance and liquid mutual fund holdings enable it to earn risk-free returns of 6.5%-7%. These treasury gains reduce the headline ROE.
ROCE vs ROE: The reinvestment rate
A company’s capacity to reinvest its earnings back into its core business determines its ability to compound growth. The following rule of thumb will give you an idea of the power of reinvestment:
Intrinsic Value Compounding Rate = ROIC (or ROCE) * Reinvestment Rate
If a company earns a ROCE of 40% but has a limited opportunity to reinvest its earnings (say 10%), for instance, it would have to payout the remaining 90% as dividends. This will allow it to grow its earnings at 4% per annum (40% × 10%). Alternatively, if a firm had a ROCE of 20% and a 70% reinvestment rate, it would be able to compound its earnings at 14% annually (20% × 70%).
ROCE vs ROE: Alpha generation for investors
While a ROCE screen of more than 20% can get you quality compounders, the alpha generation potential depends on your exit tax liabilities. Here’s why:
Exit Tax Insight: Holding Period Taxation
While holding period tax implications on long-term capital gains (LTCG) are relatively benign, short-term capital gains (STCG) are brutally high (40%) for equity shares in India.
- Exit Taxation Example: If an investor buys shares in a high-growth company with a ROCE of 30% and sells them within a year, he/she would have to pay a 40% STCG tax. However, if he/she were to hold the same shares for more than a year, the LTCG tax would reduce to 12.5%.
Use our Capital Gains Tax Calculator to estimate your post-tax net returns from selling winning stocks in your portfolio.
ROCE vs ROE: Checklist
While screening Indian equities using ROCE and ROE, keep these pointers in mind:
- Always assess ROCE: ROCE is a critical proxy for operational efficiency. Firms with ROCE below 12% don’t generate enough returns to compensate for the cost of capital.
- Compare ROCE to Interest Rates: ROCE should be 400-500 bps higher than average interest rates on long-term debt.
- Evaluate Leverage before relying on ROE: If ROE 25%, analyze the capital structure to ensure that the returns aren’t leverage-driven.
- Avoid using ROCE for financial sectors: ROCE is not an appropriate metric for analyzing the financial health of banks, NBFCs, and housing finance companies. Instead, use ROA, ROE, Net Interest Margin (NIM), and Gross NPAs.
- Look for consistency in ROCE: A ROCE above 18% for 5 or more consecutive years in a cyclical commodity-based sector is a good sign.
Sources & References

Valuenomy Research
Capital Markets & Valuation DeskValuenomy Research Desk is comprised of certified financial analysts focusing on DCF valuation modeling, Indian direct taxation analysis, and quantitative equity risk management.
View Editorial Profile & MethodologyRegulatory Compliance & Statutory Disclaimer
The financial models, valuation projections, brokerage summaries, and target estimations presented on Valuenomy are curated solely for academic research, mathematical evaluation, and investor education purposes.
Valuenomy is not a SEBI-registered investment advisor or research analyst. Securities markets are subject to high market risks. Always review underlying corporate filings and consult an authorized SEBI-registered financial advisor before executing capital decisions.